
The best fit is not the best model
How much do you expect to earn tomorrow if you have earned today € 200? And yesterday € 100, the day before € 200, and three days ago € 100? These are your data and they are shown as the four orange dots.
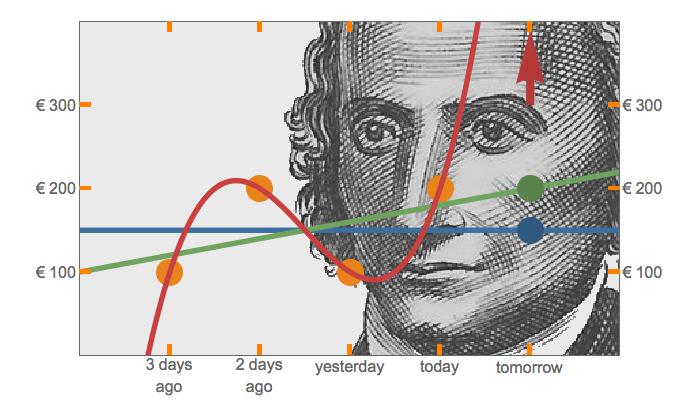
To predict you need a model – the red, green and blue lines. A model is an approach to the question: what is the information in your data? For a reliable model, knowledge is required that is not in the data. With this background knowledge, you can make a choice between the red, green and blue line.
The blue line is the average of all four data values, being € 150. So the prediction for tomorrow is € 150, as shown by the blue dot.
The green line is the best fit of a straight line to the four points. This model predicts € 200 for tomorrow, the green dot. Both the blue and the green line do not pass through the four orange dots.
The red line is the only model that goes exactly through the four data points – it is the perfect fit. The prediction for tomorrow is a whopping € 900, well beyond the scale of the figure and therefore indicated by the red arrow.
However, € 900 seems unrealistic given the data and our background knowledge about how money is being earned. The green or blue line appear to be a better choice. The best fit is not the best model, because we have background knowledge to assess the different models.
The Italian-French mathematician Joseph-Louis Lagrange (1736-1813) overlooks our work. He has laid the foundation for regression models.