
Use everything you know
You cannot do inference without making assumptions – Sir David MacKay (1967 – 2016)
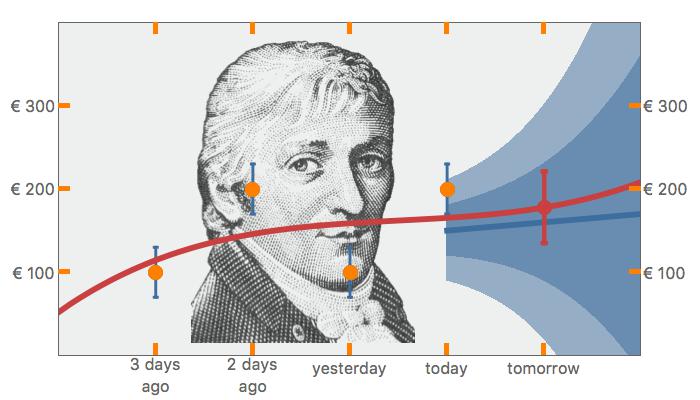
In What is your Model the following question was asked: How much do you earn tomorrow if you have earned €200 today? And yesterday €100, €200 the day before and three days ago €100?
These are your data and are represented by four orange dots. Now comes the Bayesian approach.
Carl Friedrich Gauss (1777 – 1855)
The first question is: What do you know about your data? Real data always possess an uncertainty. In our case, the €200 is what we have in our hand, but this is not the exact turnover. There are roundings made, mistakes in the exchange, etc. The exact turnover is unknown.
The second question is: What do you know about the process? In this case, about how the money is earned. Is the supply and demand almost always constant or is it a growing market? And how big is this growth? How much knowledge do you have about the market?
The answer to the first question is indicated by the blue error bars on top of the data. Usually, a Gaussian function is chosen for this purpose. The four Gaussian functions together give the Likelihood of the data.
The answer to the second question is represented by the blue area. This is also a Gaussian function that fans out as we go further into the future. This area describes our knowledge of the market and is called the Prior.
Together, the Likelihood and the Prior yield the Posterior, which is also a Gaussian function. The maximum of this Posterior is the red function. The red point is the forecast for turnover for tomorrow (€ 178) with the corresponding margin (€ 43).
This is the Bayesian approach in a nutshell. The young Carl Friedrich Gauss (1777 – 1855) looks upon us with an encouraging smile.
Would you like to know more about Bayesian statistics. Follow our Bayesian statistics course!